

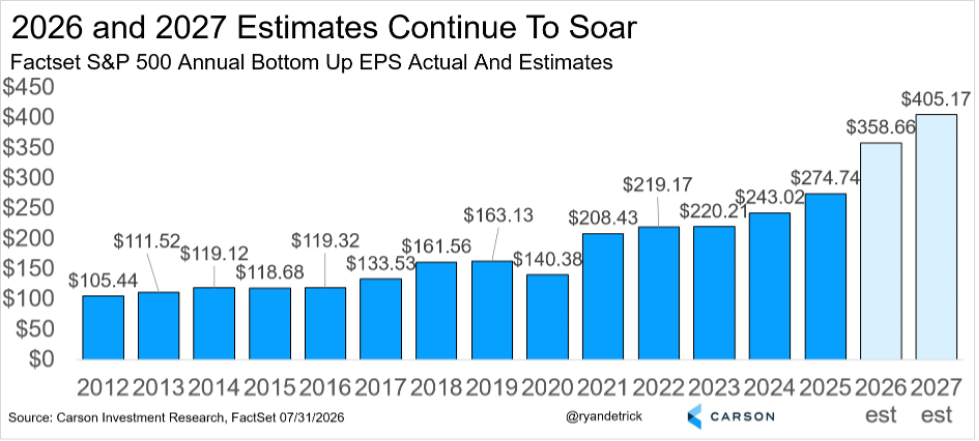
Stocks soared last week, with the S&P 500 gaining more than 3.5% while the tech-heavy Nasdaq soared more than 5%, both making new all-time highs along the way. Sparking the surge was continued strong overall earnings. According to FactSet, Q2 S&P 500 earnings are now up a staggering 50.4%, the best since Q2 2021. At the start of earnings season, earnings were expected to be up approximately 23%, and they were up 38% just two weeks ago. Additionally, 86% of companies have reported earnings that came in better than expectations, one of the highest beat rates ever. Earnings have historically driven long-term stock gains, and this remains a big reason why stocks have done so well this year.
Big Picture
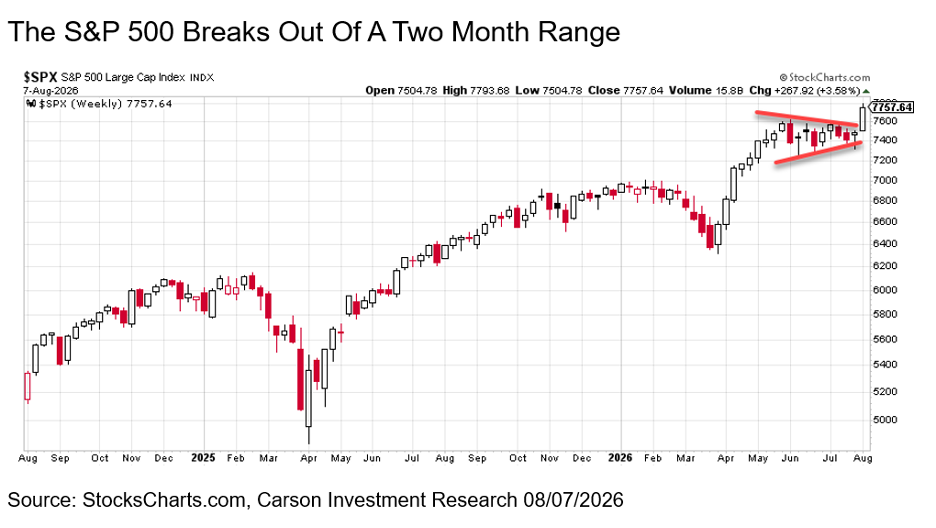
Let’s take a big-picture look at the past several months. Coming off the late March lows, the S&P 500 soared 16% in April and May, one of the greatest two-month rallies ever. As we noted then, historically, large surges like that have tended to resolve higher, but they very well could need a pause first. Stocks can correct two ways: through price and through time. As we show below, the S&P 500 corrected via time, moving virtually sideways for 11 weeks to catch its breath before the big breakout last week. All in all, we view this as perfectly healthy market action, and it likely says the bull market continues.
Yes, if you were all in on the high-flying momentum/AI names in July, it was a rough month. Of course, those names were up incredible amounts and more than due for a well-deserved break. Even a very large hedge fund invested in these names (and using too much leverage) nearly went under before it found a buyer for some of its securities. But this is why we’ve stressed remaining diversified in this bull market, instead of only chasing the best groups. We find it extremely encouraging to see how bank stocks, for instance, took the baton in July, even as semiconductors and other former leaders fell. The lifeblood of a bull market is rotation, and we continue to see that currently.
Breadth Remains Strong
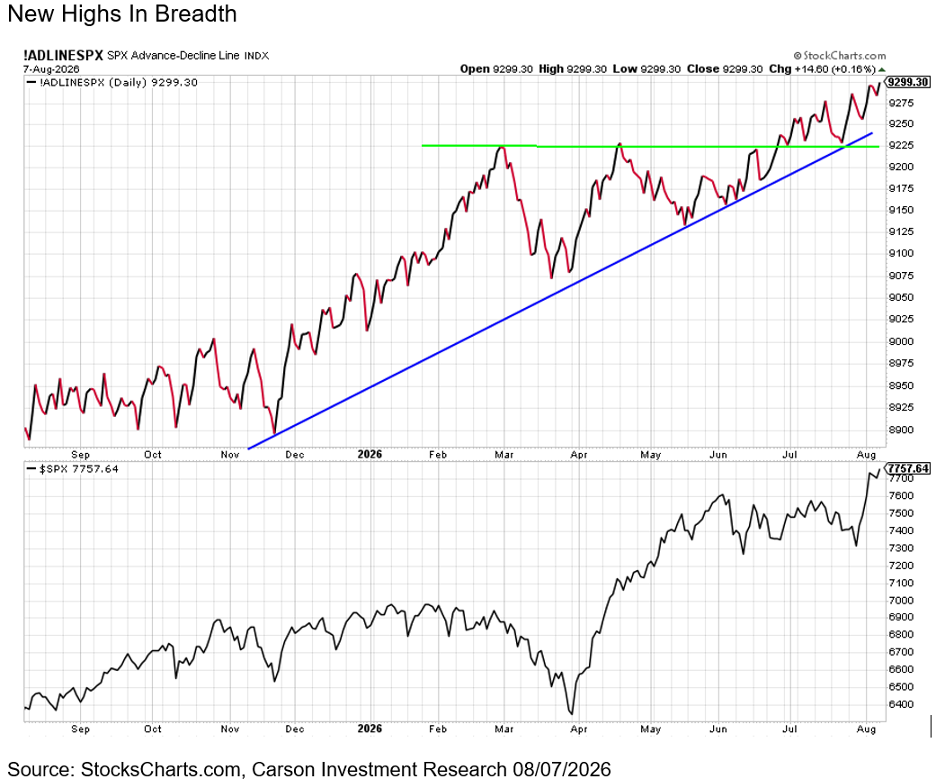
One of our favorite ways to measure market breadth is by looking at advance/decline lines. These are simply a cumulative tally of how many stocks are going up versus down each day. To see A/D lines trending higher is a clue things are healthy under the surface. Even though many highfliers were cracking in July, A/D lines held up well, providing a clue that things weren’t about to crash like so many on TV were claiming. The S&P 500 A/D line just hit more new highs this week, supporting our view that this bull market is alive and well.
The Bull Continues and Isn’t as Old as You Think
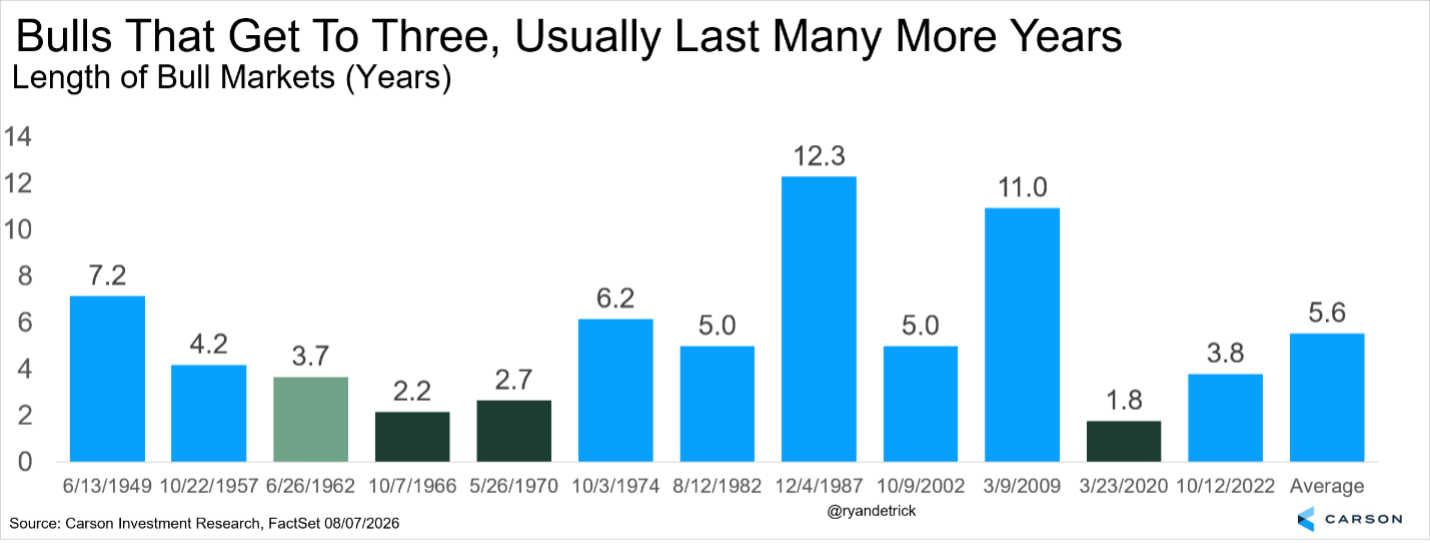
With the S&P 500 back at new highs, the bull market is officially 3.8 years old (it’ll turn four in October). As we’ve noted many times (most recently in our Midyear Outlook: Still Riding the Wave), bull markets have historically tended to last much longer than many investors think.
The opinions contained in this complimentary download is provided entirely on behalf of CWM, LLC and is in no way related to Cetera Wealth Services LLC, or its registered representatives. This information is from sources believed to be reliable, but Cetera Wealth Services LLC cannot guarantee or represent that it is accurate or complete.
In fact, once a bull market has made it to its third birthday, there could be many more years of gains. You have to go back to the 1960s to find the last bull market that made it to three years old but didn’t make it to four. More recently? Over the past 50 years, five bull markets made it past year three, and every single one of them made it to at least year five. While that’s a small sample, this bull market very well could continue to frustrate the bears for much longer.
The Labor Market Remains Fine
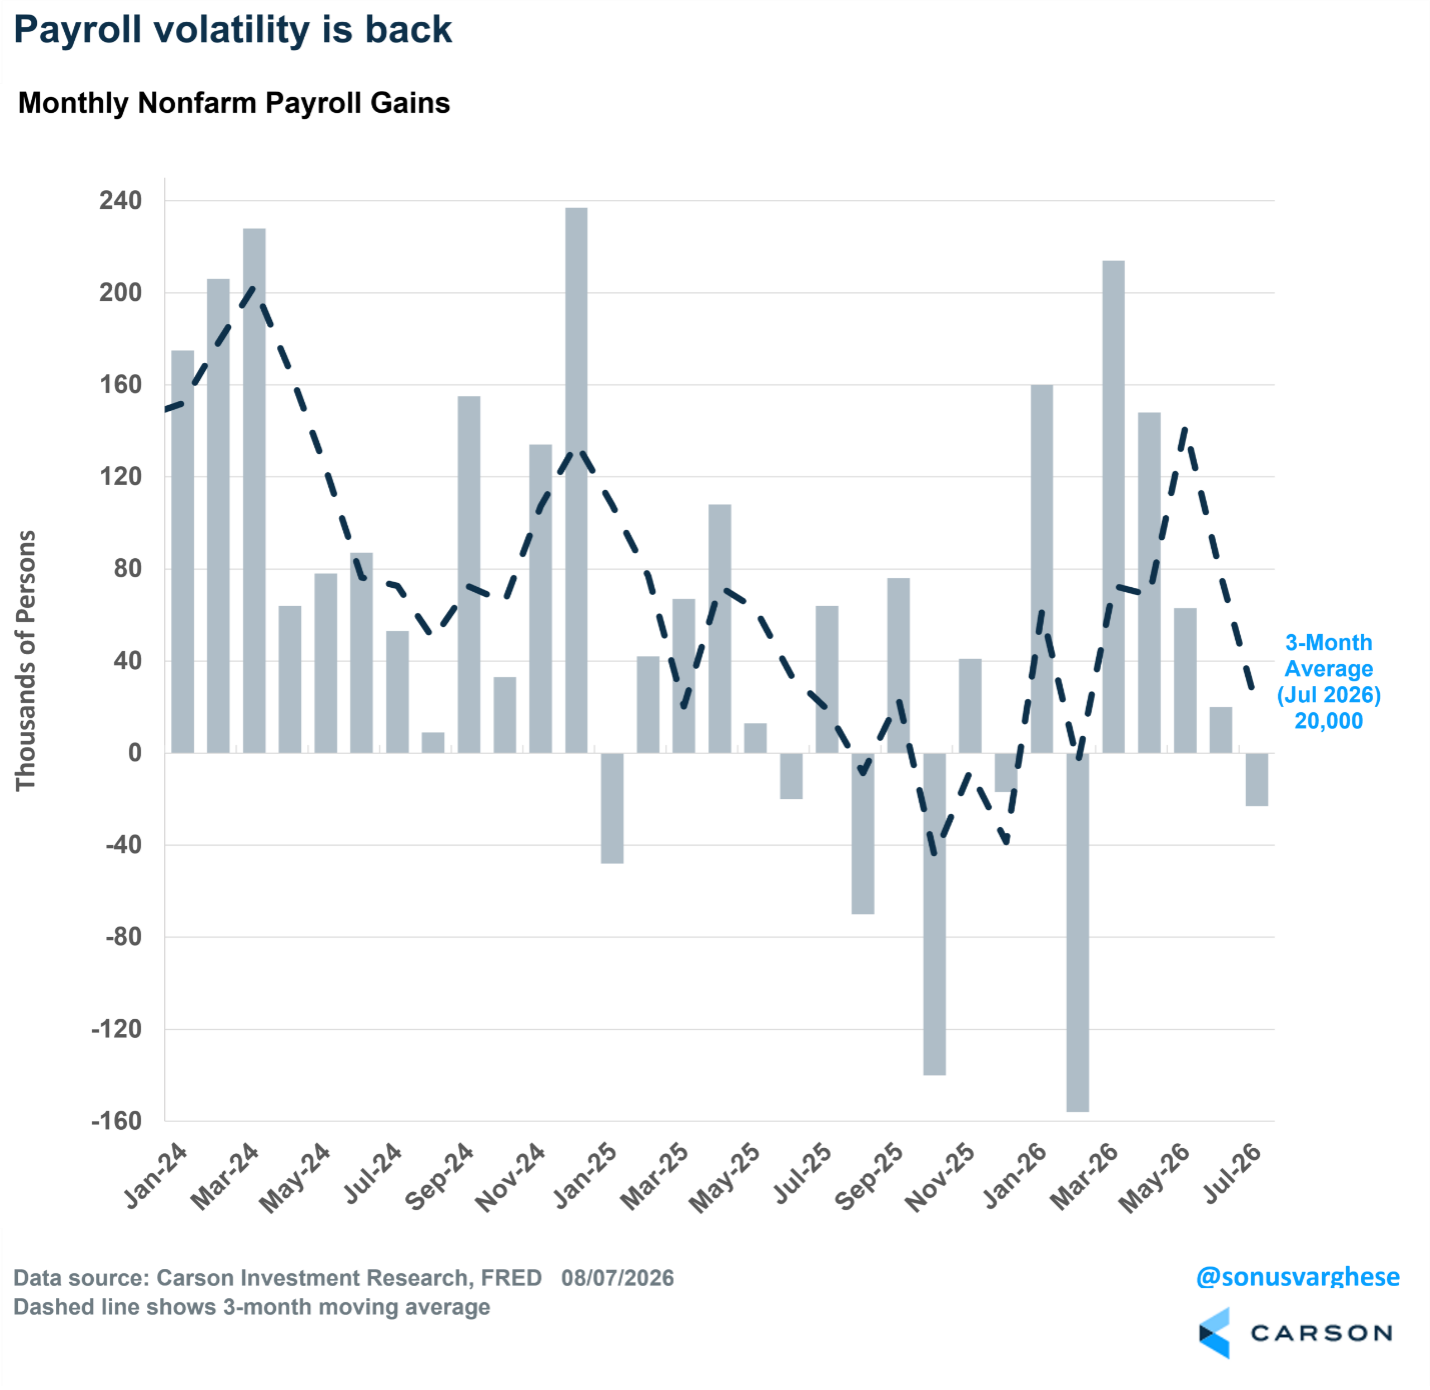
Last month, we wrote that the payroll data threw us a bit of a curveball, and here we are again. The economy shed 23,000 jobs in July, well below expectations for an 80,000 gain. The headline number looks ugly, but payroll data comes with a lot of noise, and the noise has been especially loud lately. Once you step back and focus on the big picture, we believe the labor market is in fine shape. Let’s walk through it.
Start with the miss itself, because it wasn’t just July. We also got sizable downward revisions to prior months. June was cut from +57,000 to just +20,000, and May, originally reported at +172,000, now stands at +63,000. Put together, employment in May and June was 103,000 lower than previously reported. (April went the other way, revised up before settling at +148,000.) A month ago, we noted that the second quarter was averaging 111,000 jobs a month. After revisions, that average is closer to 77,000, and the 3-month average through July is now running at just 20,000. This is exactly why we keep saying not to put too much weight on any single payroll print. The revisions can change the story well after the fact, and right now, the story they’re telling is of a labor market that’s growing more slowly than the initial numbers suggested.
So, what happened in July? A lot of it looks like quirks rather than genuine weakness. Government payrolls fell 53,000, almost all of it in local government education, which shed 50,000 jobs. That’s very likely a seasonal adjustment issue tied to school calendar timing rather than school districts suddenly laying off teachers en masse. Leisure and hospitality fell 40,000, and the timing there is telling. The World Cup gave those industries a hiring boost earlier this summer, and July looks like the payback as that rolled off. Retail also declined by about 19,000, concentrated in warehouse clubs, supercenters, and general merchandise stores (-21,000), along with gasoline stations (-5,000). Financial activities shed another -14,000. On the plus side, healthcare added 22,600 jobs and continues to do a lot of the heavy lifting.
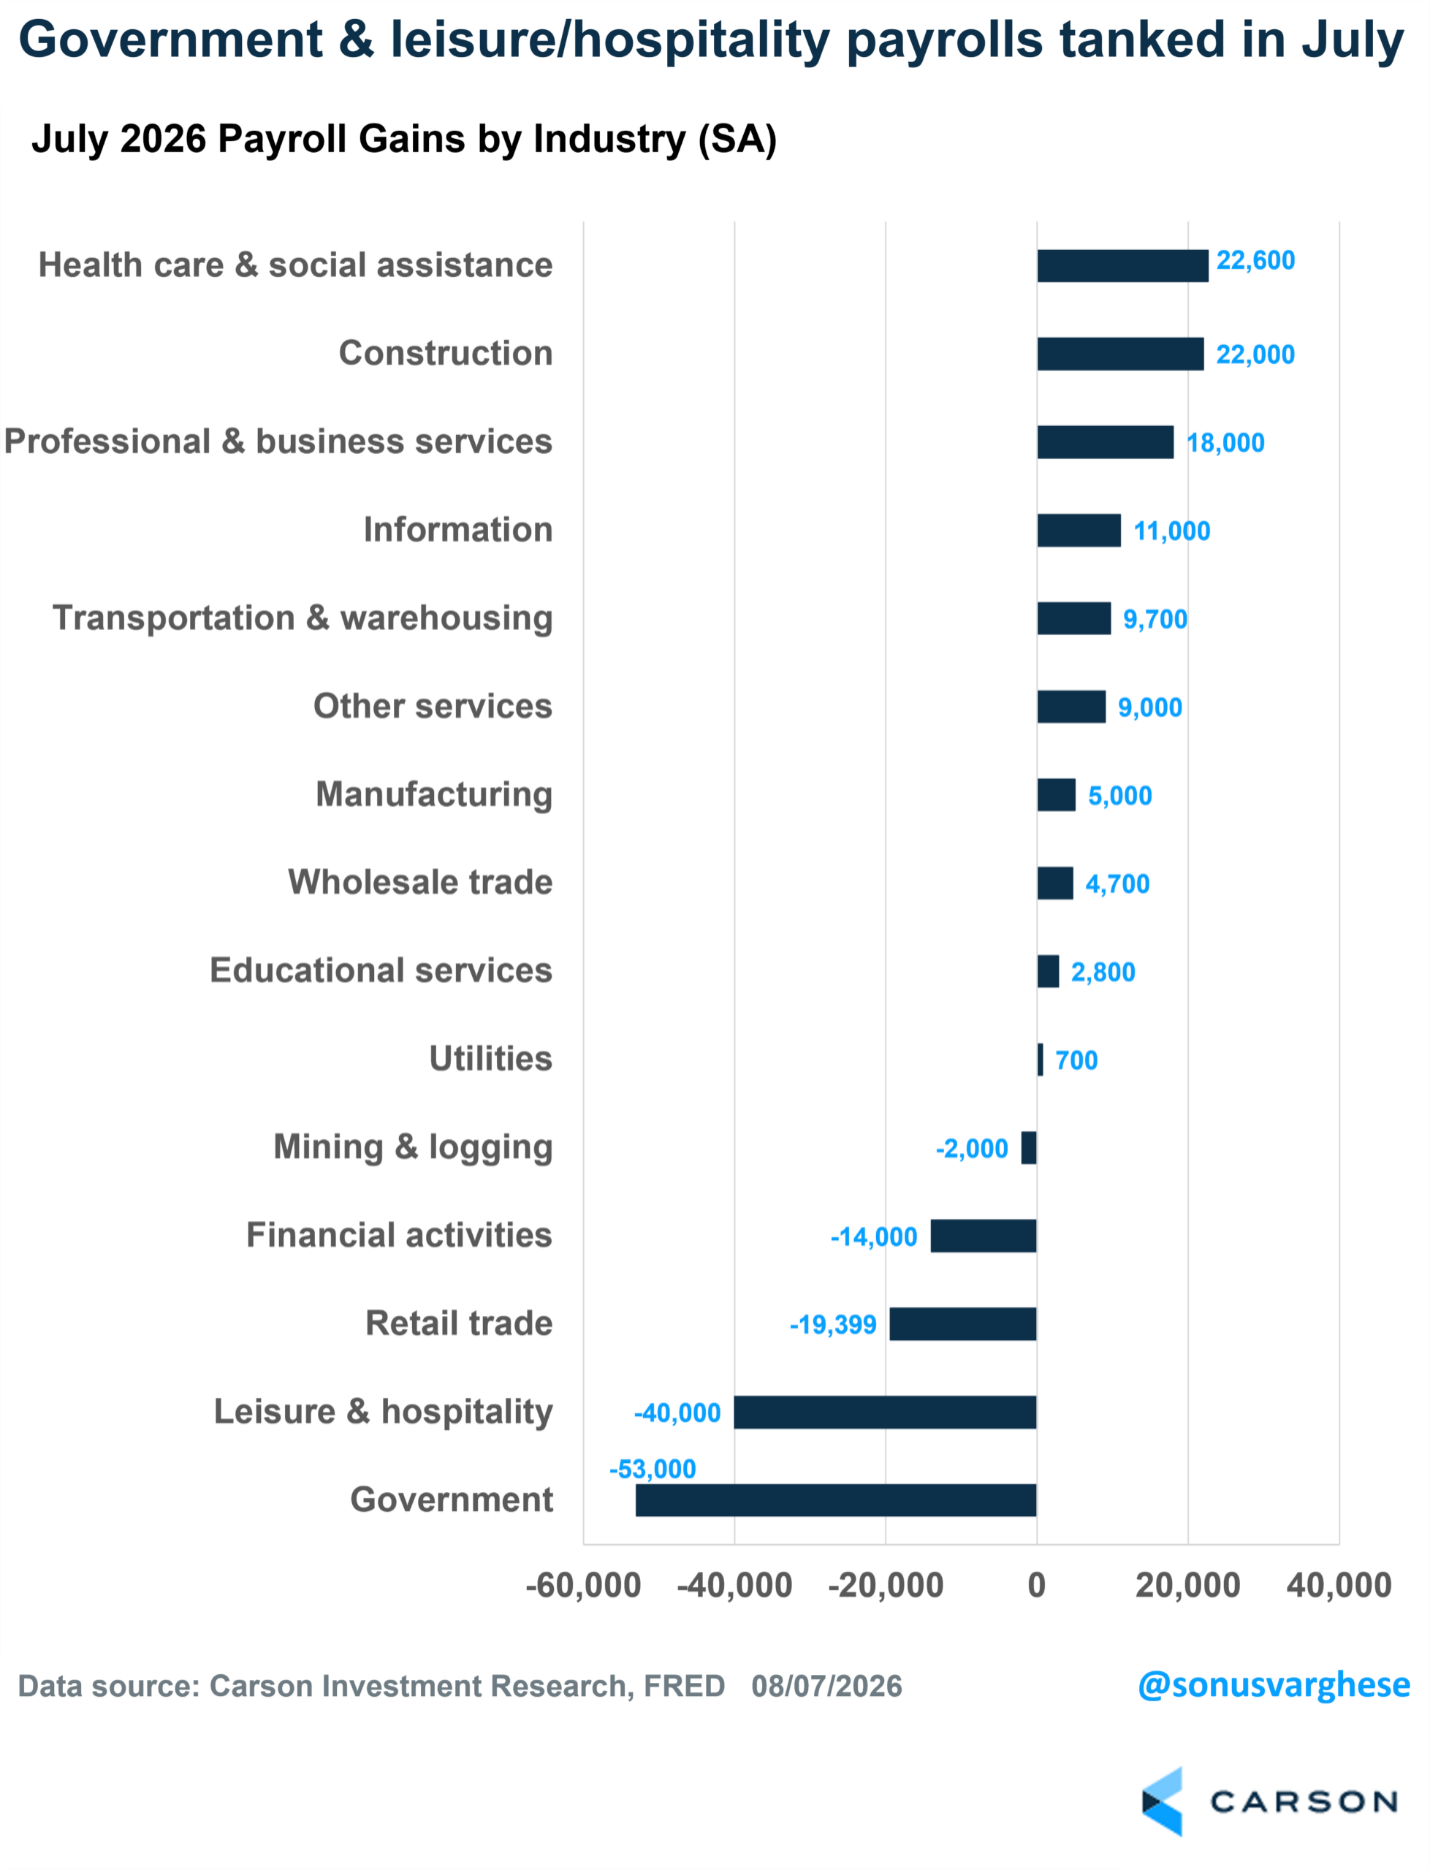
One interesting detail: Construction added 22,000 jobs in July, and the gain came entirely from specialty non-residential contractors. Housing is not driving that. The much more likely explanation is the data center construction boom, which keeps showing up in the hard data even as people debate whether AI capex is sustainable. For now, it’s putting people to work.
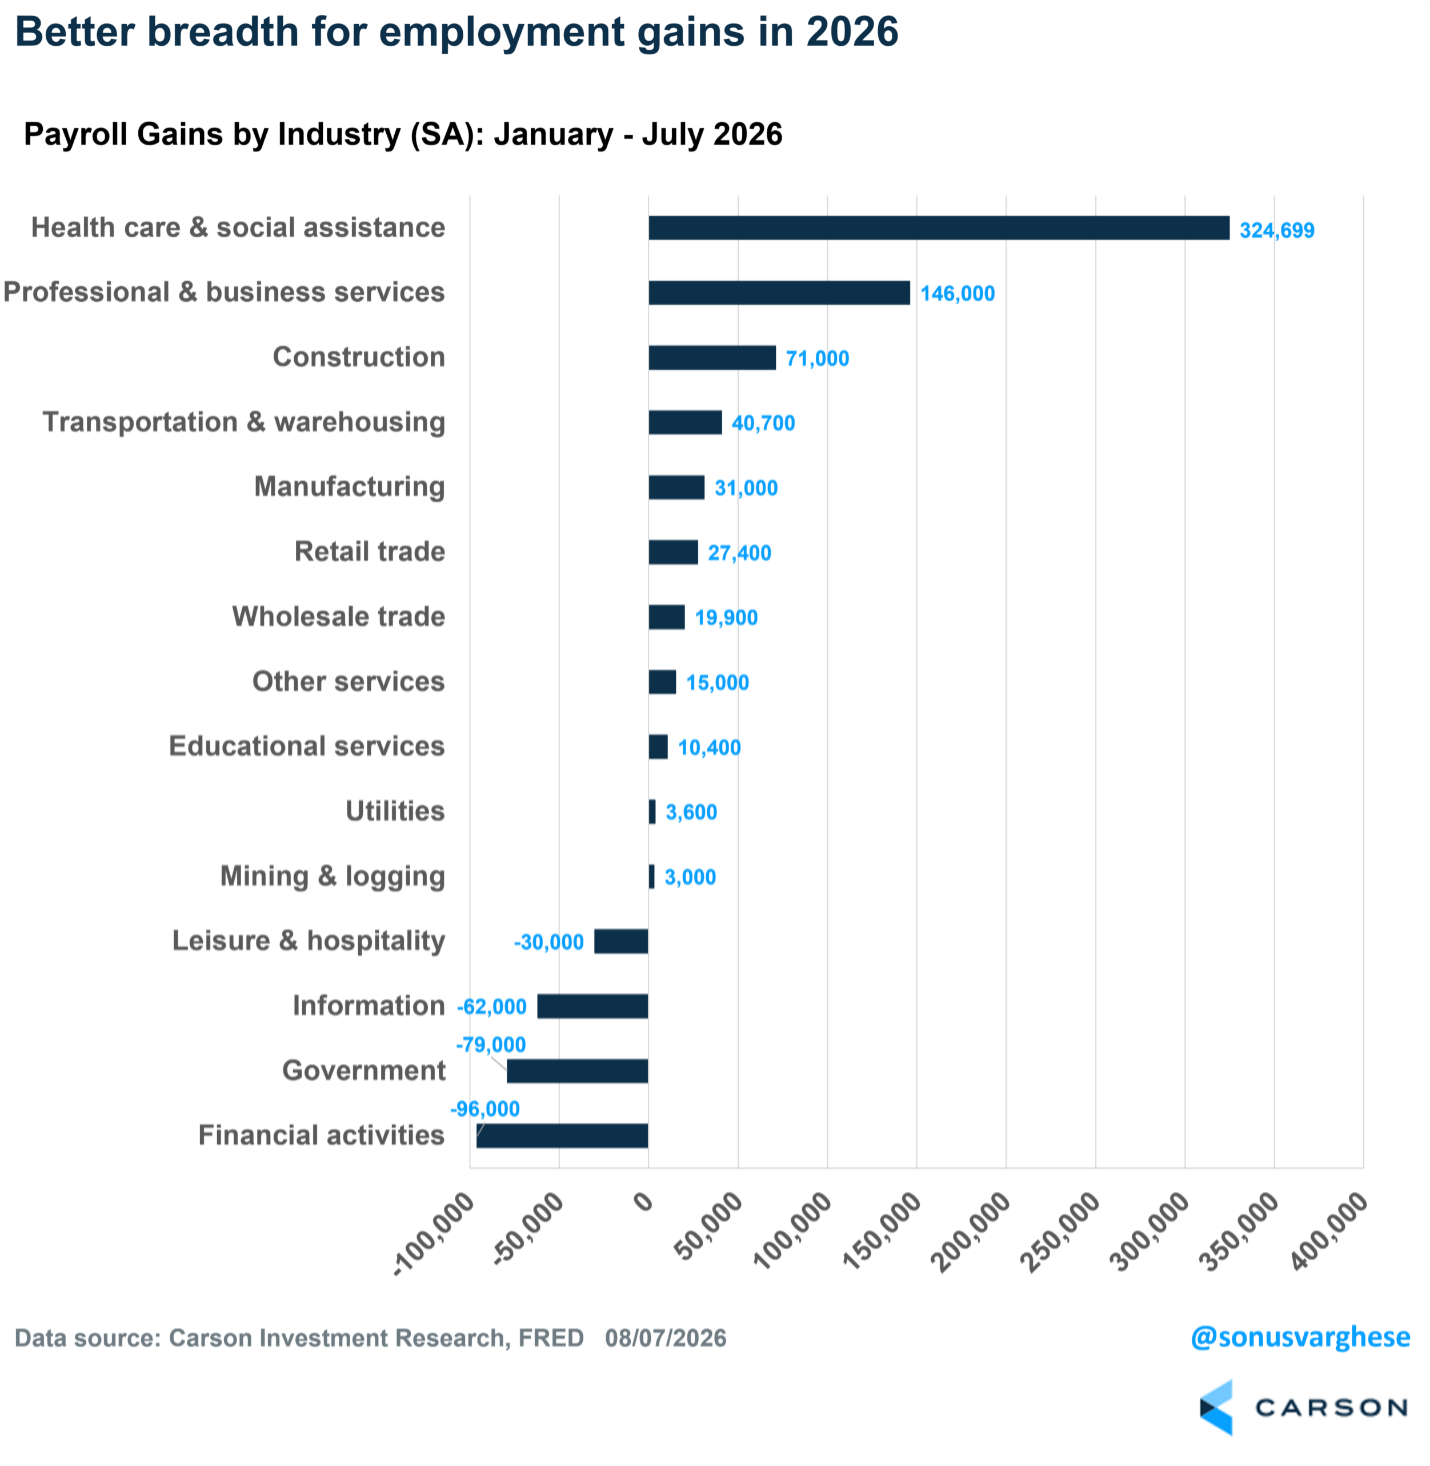
Zooming out to the full year makes the picture look better than the July headline. Job gains in 2026 have been broader than what we saw last year, when healthcare and not much else was carrying the load. Healthcare and social assistance still leads with about 325,000 jobs added through July. Still, professional and business services has added 146,000 and construction 71,000, with additional gains across transportation, manufacturing, retail, and wholesale trade. The weak spots are concentrated in financial activities (-96,000), government (-79,000), and information (-62,000). That’s a real drag, but it’s a narrow one.
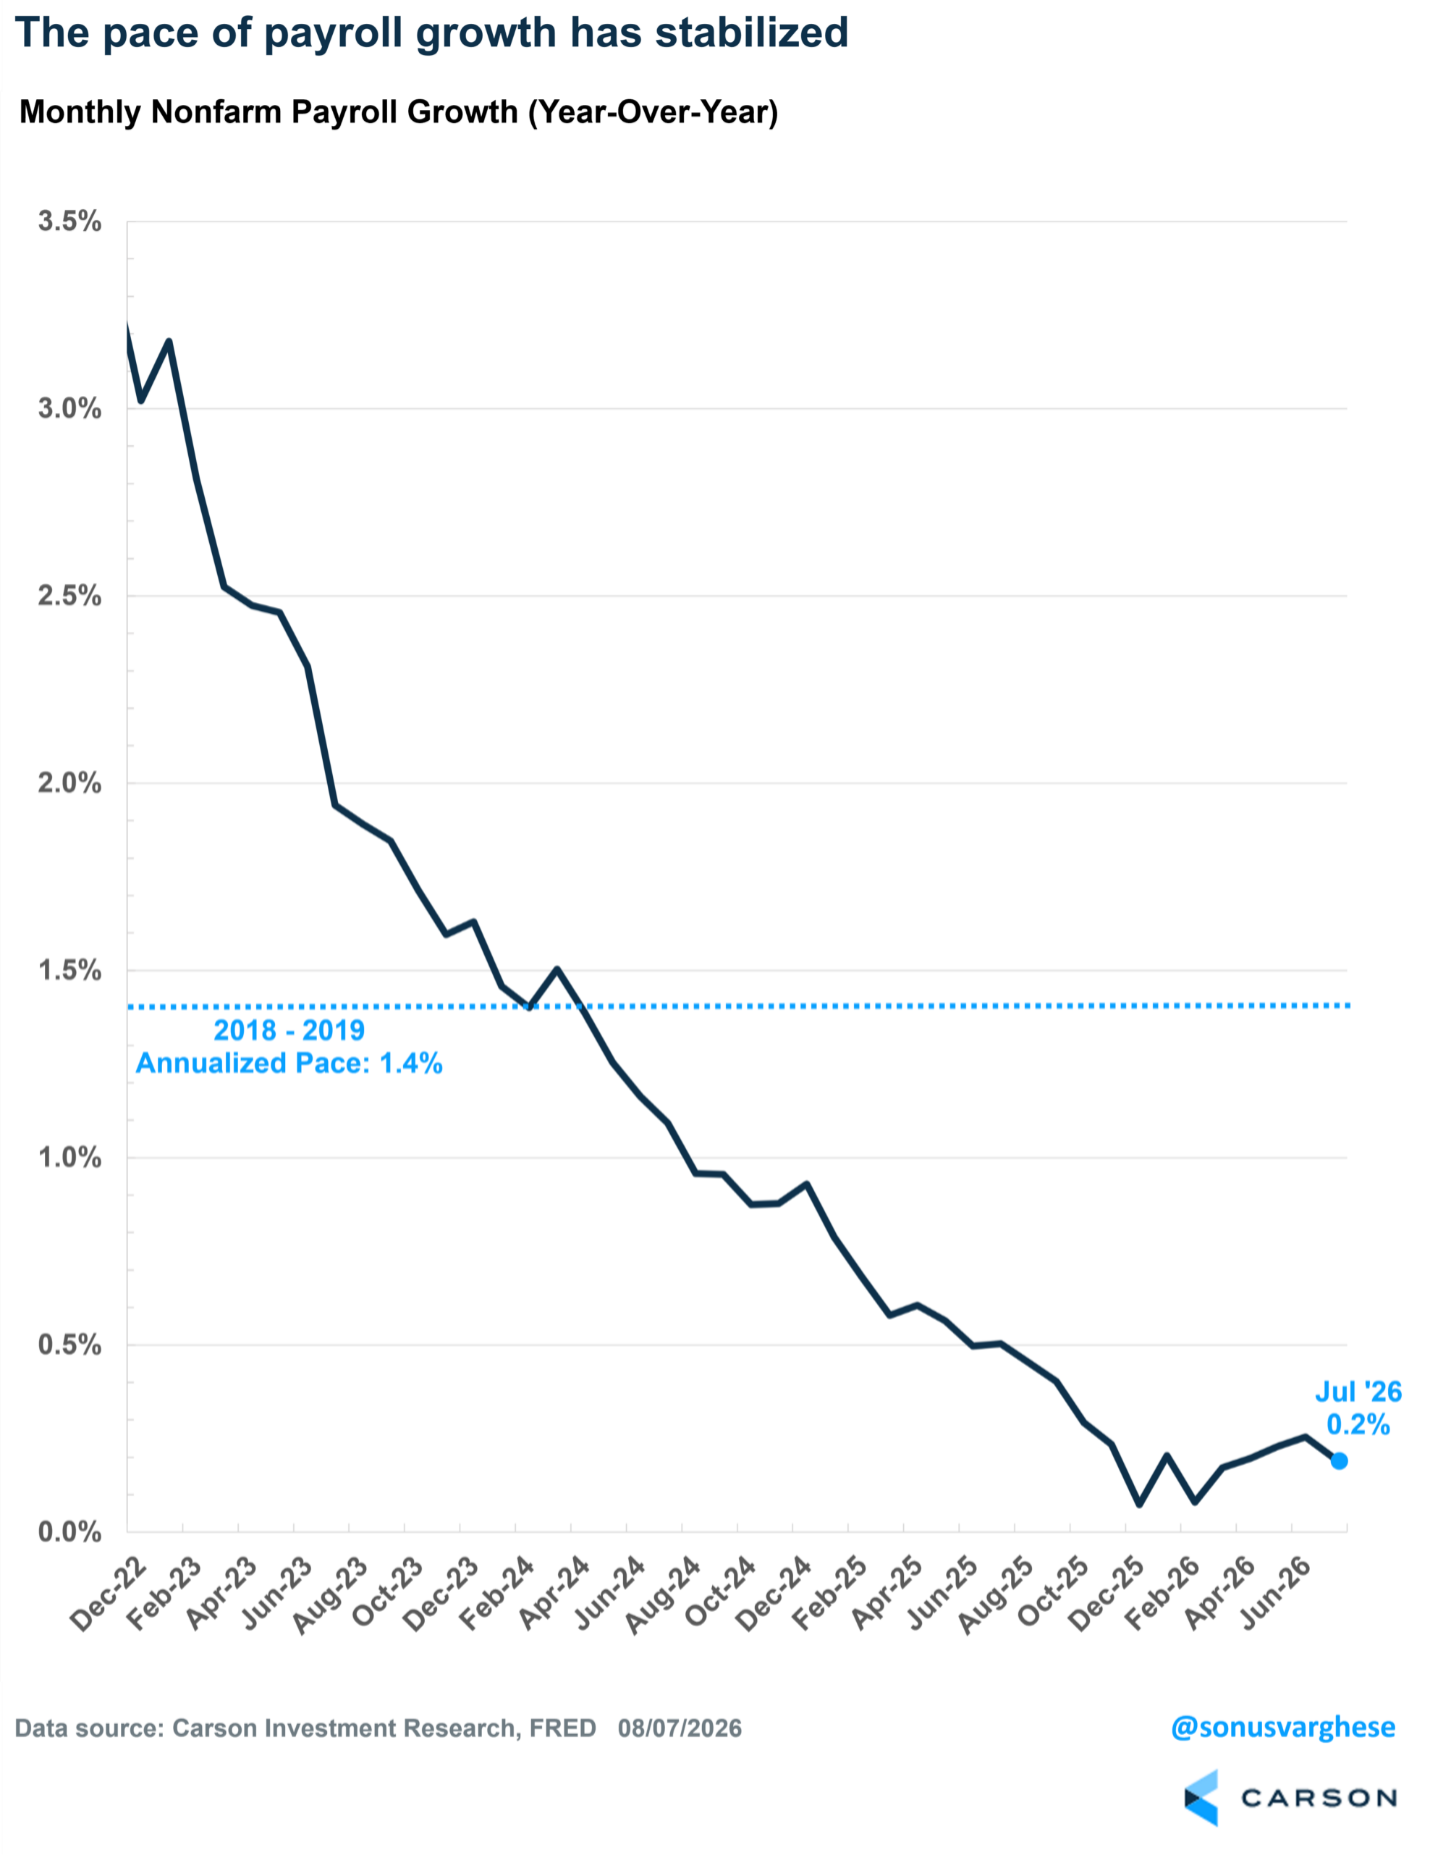
Another way to see where the labor market stands is the year-over-year pace of payroll growth, which is running at 0.2%. That’s well below the 2018-19 pace of 1.4%, but the important thing is that the line has stopped falling. Job growth has stabilized, albeit at a low level, and that’s consistent with a labor market where supply has shrunk. With immigration having slowed sharply, there are fewer workers available to hire, which also means the “break-even” pace of job growth needed to hold the unemployment rate steady is much lower than it used to be. The economy likely needs to create fewer than 50,000 jobs a month to keep the unemployment rate from going up. However, the payroll survey has a 90% confidence interval of plus or minus 120,000 jobs, which means a negative payroll print shouldn’t be surprising.
The Big Picture: Unemployment Is Historically Low, and Layoffs Are Even Lower
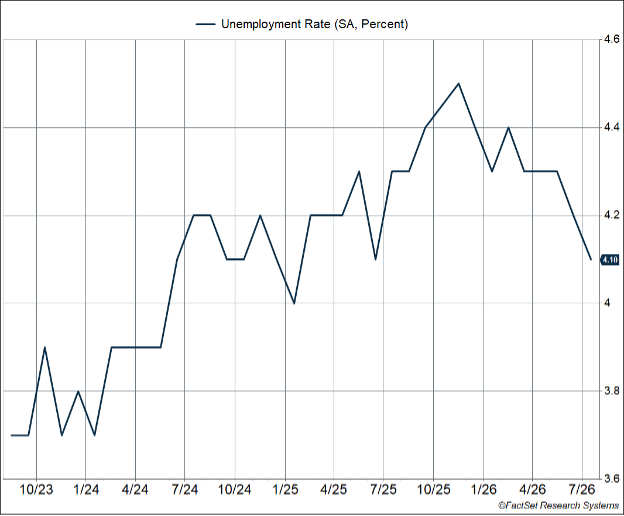
Which brings us to the best news in the report. The unemployment rate eased to 4.1% in July, the lowest level in a year. The rise we saw in 2025, when the unemployment rate climbed as high as 4.5% late last year, has now been fully unwound. Keep some perspective here: 4.1% is a historically low unemployment rate. It only looks elevated relative to mid-2023, when it plunged to 3.5%. What’s remarkable is that the unemployment rate rose, stabilized, and then reversed. Historically, once the unemployment rate starts climbing, it tends to keep climbing until we’re in a recession. That has not happened this cycle.
The prime-age employment-population ratio backs this up. The share of 25-54-year-olds with a job rose to 80.4% in July. We like this measure because it cuts through a lot of the noise in the unemployment rate itself. A very high proportion of Americans in their prime working years are employed right now, and that’s not what a deteriorating labor market looks like.
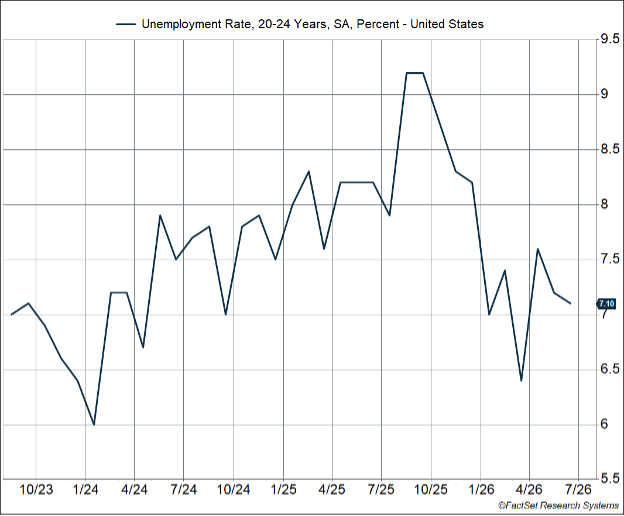
It’s also worth addressing the AI question, since “AI is taking entry-level jobs” has become a popular narrative. The data doesn’t support it, at least not yet. The unemployment rate for 20-24-year-olds eased to 7.1% in July, well below the 9.2% peak we saw last fall and back in line with in 2023, when the labor market was running hot. The unemployment rate for teenagers (16-19-year-olds) has been falling as well. If AI were displacing young workers at the entry level, you’d expect exactly the opposite: unemployment rates for the youngest workers rising even as everyone else held steady. Instead, young workers’ job prospects have been improving for most of this year.
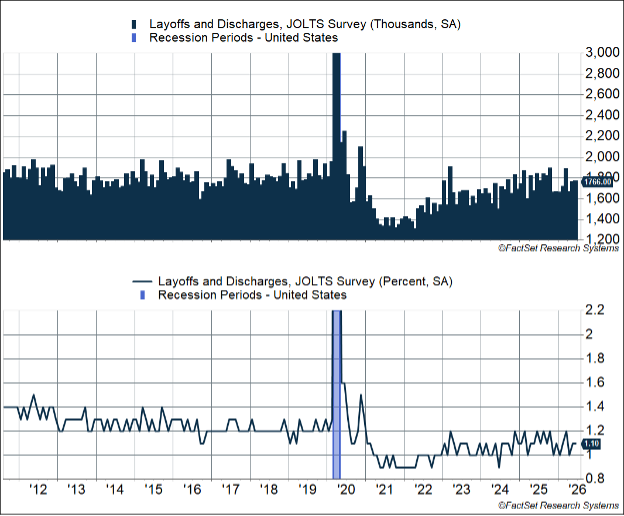
Finally, layoffs. The latest JOLTS data shows layoffs and discharges running at about 1.77 million, with the layoff rate at 1.1%. That’s below the 1.2% to 1.4% range that prevailed across the entire pre-pandemic decade. Initial claims for unemployment benefits tell the same story and remain very low by historical standards. Companies may not be hiring aggressively, but they’re not cutting, either. This has been the defining feature of the labor market for a while now: low hiring, low firing.
Add it all up, and the July payroll report is less alarming than the headline suggests. The miss was driven largely by seasonal quirks in education payrolls and payback from the World Cup hiring boost, while the underlying trend of job growth is slow but stable, held down as much by labor supply as by demand. Meanwhile, the unemployment rate is the lowest in a year and near historic lows, prime-age employment is elevated, and layoffs remain unusually rare. Payrolls may be shaky, but we believe the labor market is fine. That’s good news for households and, ultimately, good news for the economy.
S&P 500 — A capitalization-weighted index of 500 stocks designed to measure performance of the broad domestic economy through changes in the aggregate market value of 500 stocks representing all major industries.
The NASDAQ 100 Index is a stock index of the 100 largest companies by market capitalization traded on NASDAQ Stock Market. The NASDAQ 100 Index includes publicly traded companies from most sectors in the global economy, the major exception being financial services.
The views stated in this letter are not necessarily the opinion of Cetera Wealth Services LLC and should not be construed directly or indirectly as an offer to buy or sell any securities mentioned herein. Investors cannot invest directly in indexes. The performance of any index is not indicative of the performance of any investment and does not take into account the effects of inflation and the fees and expenses associated with investing.
A diversified portfolio does not assure a profit or protect against loss in a declining market.
All investing involves risk, including the possible loss of principal. There is no assurance that any investment strategy will be successful. This information is from sources believed to be reliable, but Cetera Wealth Services, LLC cannot guarantee or represent that it is accurate or complete.
9067303.1-0826-C
